DELPHI ENERGY CORP (TSE:DEE)
 | Strong Uptrend  |
| Smart Scan Chart Analysis continues positive longer term. Look for this market to remain firm. Strong Uptrend with money management stops. A triangle indicates the presence of a very strong trend that is being driven by strong forces and insiders. Based on a pre-defined weighted trend formula for chart analysis, DEE scored +90 on a scale from -100 (strong downtrend) to +100 (strong uptrend): | |  | |  | -10 | Last Hour Close Below 5 hour Moving Average |  | +15 | New 3 Day High on Thursday | | +20 | Last Price Above 20 Day Moving Average | | +25 | New 3 Week High, Week Ending September 19th | | +30 | New 3 Month High in September | | | +90 | Total Score | | |
| |
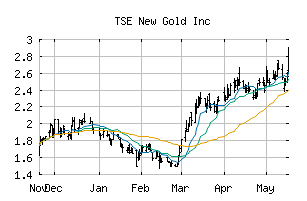
NEW GOLD INC (TSE:NGD)
 | Strong Uptrend |
| Smart Scan Chart Analysis continues positive longer term. Look for this market to remain firm. Strong Uptrend with money management stops. A triangle indicates the presence of a very strong trend that is being driven by strong forces and insiders. Based on a pre-defined weighted trend formula for chart analysis, NGD scored +90 on a scale from -100 (strong downtrend) to +100 (strong uptrend): | | | | | -10 | Last Hour Close Below 5 hour Moving Average | | +15 | New 3 Day High on Thursday | | +20 | Last Price Above 20 Day Moving Average | | +25 | New 3 Week High, Week Ending October 10th | | +30 | New 3 Month High in October | | | +90 | Total Score | | |
| |
YAMANA RES INC (TSE:YRI)
 | Strong Uptrend |
| Smart Scan Chart Analysis confirms that a strong uptrend is in place and that the market remains positive longer term. Strong Uptrend with money management stops. A triangle indicates the presence of a very strong trend that is being driven by strong forces and insiders. Based on a pre-defined weighted trend formula for chart analysis, YRI scored +100 on a scale from -100 (strong downtrend) to +100 (strong uptrend): | | | | | +10 | Last Hour Close Above 5 Hour Moving Average | | +15 | New 3 Day High on Tuesday | | +20 | Last Price Above 20 Day Moving Average | | +25 | New 3 Week High, Week Ending October 10th | | +30 | New 3 Month High in October | | | +100 | Total Score | | | |  | | | Open | | High | | Low | | YRI Price | | Change | | 12.75 | | 13.11 | | 12.62 | | 13.09 | | +0.47 | |    | Streaming Chart | | |
|
| |
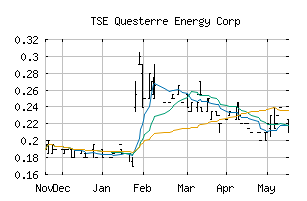
| QUESTERRE ENERGY CORP (TSE:QEC) | Strong Uptrend |
| Smart Scan Chart Analysis continues positive longer term. Look for this market to remain firm. Strong Uptrend with money management stops. A triangle indicates the presence of a very strong trend that is being driven by strong forces and insiders. Based on a pre-defined weighted trend formula for chart analysis, QEC scored +90 on a scale from -100 (strong downtrend) to +100 (strong uptrend): | | | | | -10 | Last Hour Close Below 5 hour Moving Average | | +15 | New 3 Day High on Thursday | | +20 | Last Price Above 20 Day Moving Average | | +25 | New 3 Week High, Week Ending September 26th | | +30 | New 3 Month High in September | | | +90 | Total Score | | |
| |
| |