
- Shorters have driven APHA down since Oct 18 stock price: $20.03
- The stock is now $12.69 is close to the bottom of the Bollinger Bands (12.21)
- Bullish Engulfing Nov 15 2018
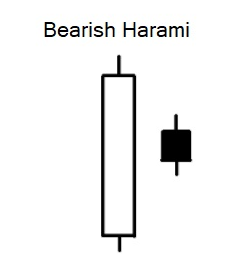
- Bearish Harmari Nov 16 2018
- The stock is trending sideways which is its normal action after shorts beat the Bulls down.
- Double Bottom formed: October 30 and Nov 15 ( 15 day pattern)
- Support line maintained at 12.69 June 6

The Bullish Engulfing Candlestick Pattern is a bullish reversal pattern, usually occurring at the bottom of a downtrend. The pattern consists of two Candlesticks: Smaller Bearish Candle (Day 1)
A bearish harami refers to a stock market trend indicating that the value of a stock is likely to experience a downwards, or bearish, momentum following a period of upward, bullish movement.
A bearish harami refers to a stock market trend indicating that the value of a stock is likely to experience a downwards, or bearish, momentum following a period of upward, bullish movement.
What is a 'Double Bottom'
A double bottom pattern is a technical analysis charting pattern that describes a change in trend and a momentum reversal from prior leading price action. It describes the drop of a stock or index, a rebound, another drop to the same or similar level as the original drop, and finally another rebound. The double bottom looks like the letter "W". The twice-touched low is considered a support level.


