The strive for growth is written in our DNA.Often, we strive for this growth at any cost.
When a nation is presented with the option of growth with the push of a button, it takes that action.
American government, corporations, and banks have taken advantage of this "button" all over the world for many years. They offer money to developing countries who are striving for growth and stability in return for "favours" that range from trade agreements to resource access.
The "end" result for the borrowers is never-ending debt; working even harder to pay back a loan that can never be repaid.
Instead of achieving economic growth - as promised by the lenders - these borrowing nations turn into the puppets of its lenders. They're no longer working to achieve growth in their own economies, but are rather forced into the growth and profits of its lenders.
Let me explain.
Let's say you borrowed $100 at 10% so that your business could achieve 15% growth in revenue. However, your forecast was wrong and your revenues end up growing only 5%.
Now you owe an extra 5% for the interest on the loan, of which you don't have.
Since you want to keep your business running, you have only two options: Either run out of money, or borrow more.
This is an extremely simplified example of how powerful banks and nations have taken advantage of developing countries all over the world.
But if you think this scheme has only been forced onto developing nations, think again; it's been forced onto all of us, including the world's most powerful nation, the United States of America.
America at the Mercy of Debt
The U.S. national debt to GDP
is above 100%. That means the nation owes more money than the value of
everything it produces in a year.
While this debt burden is due in part by the large deficits incurred to mitigate the effects of the financial crisis, and the poor recovery following the aftermath, we should note that America has been over spending for many years.
The bulk of this overspending started during the early 1970's when the government started to significantly increase spending without a corresponding increase in tax revenue; a product of the Nixon Shock - a series of economic measures enacted by United States President Richard Nixon in 1971. More importantly, it included unilaterally canceling the direct convertibility of the United States dollar to gold which ended the existing Bretton Woods system of international financial exchange and ushering in the era of freely floating currencies that remains to the present day (
see America's Gold Wiped Out.)
As I said earlier, when a nation is given the opportunity to grow with the push of a button, it takes it.
Since America pushed this button in the 1970's, the reigns have yet to be pulled back.
This trend has only gotten worse.
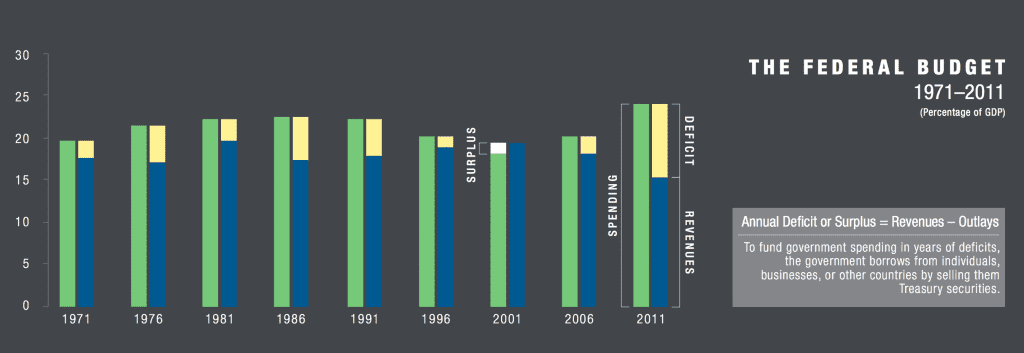
America is now spending significantly more, while bringing in less. Take a look:
 |
| Source: Congressional Budget Office |
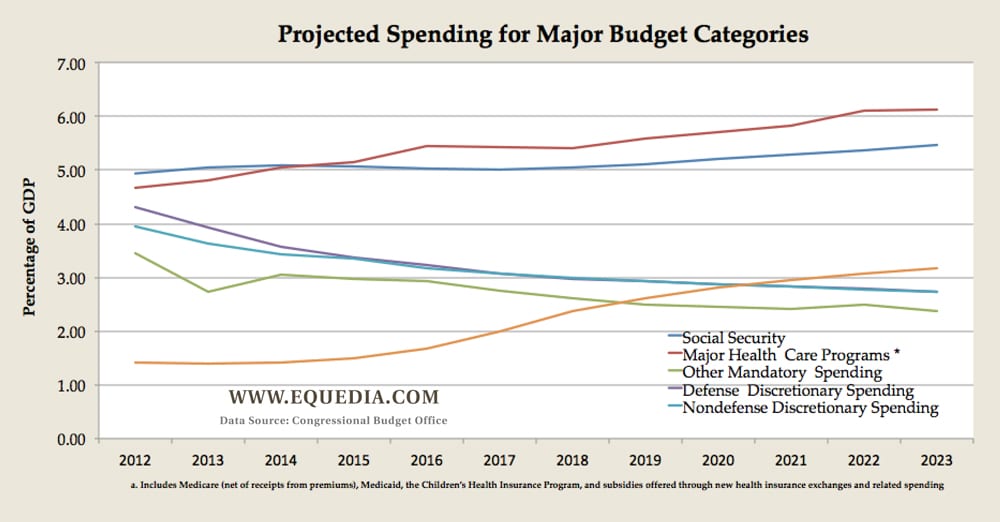
Despite the above projections that show revenues and outlays will grow in-synch over the next few years (but still running a heavy deficit), we have to note that most of the increase in deficit spending over the years - and moving forward - can be attributed to increases in Medicare:
I am not going to debate the pros and cons of Obamacare and turn this into a political debate.
Borrowing from Peter to Pay Paul
Obama promises cost-savings over the long haul under Obamacare, but that is something that can be seriously debated.
What cannot be debated is that Obamacare is going to cost taxpayers a lot more upfront, which in turn will add to the deficit and the national debt quickly.
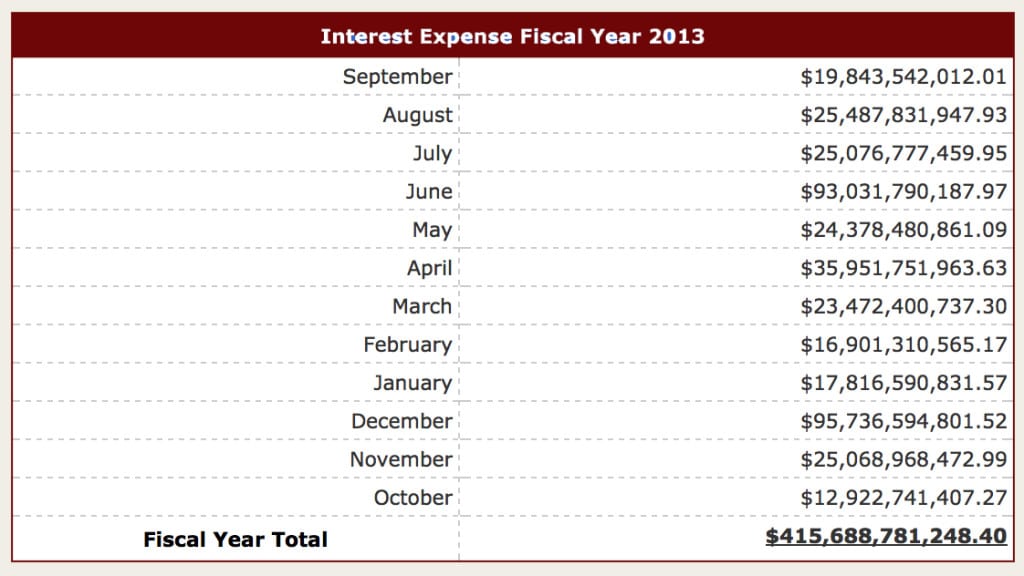
The below chart shows the interest payments of America's outstanding debt, which includes the monthly interest for: U.S. Treasury notes and bonds, Foreign and domestic series certificates of indebtedness, notes and bonds, Savings bonds, Government Account Series (GAS), State and Local Government series (SLGs) and other special purpose securities.
In the last 12 months America has paid nearly half a trillion dollars in interest alone.
If interest rates were any higher, this number could soon reach the trillion-dollar mark within the next few years. That's why America will do everything in its power to keep rates low.
As I
mentioned last week, the government's main source of income is tax revenue. On a federal level, the U.S. government is estimated to collect about $2.7 trillion this year, of which $1.9 trillion comes from income tax (not including sales taxes and property taxes, and social insurance taxes such as Social Security, unemployment and hospital taxes.)
That means 22% of the income tax an American pays goes directly to servicing America's debt.
In other words, nearly a quarter of all federal income tax revenue goes directly to paying only the interest on loans.
At the rate America is borrowing and spending, no amount of taxes will solve the growing debt issue.
Furthermore, raising taxes would significantly affect output; higher taxes equals less growth, and less growth equals less taxes.
Like the developing nations of the world who borrow from America and other wealthier sources, we too are trapped in this debt bubble.
America's debt ceiling will continue to climb every year, and simple mathematics tell us that America will need to keep borrowing to continue moving forward.
And since the
real demand for U.S. debt continues to shrink (
see a Shocking 2011 Cover-Up), there is only one private institution that can provide funds for America's growing debt: the Fed.
In other words QE has become the norm.
So where does that leave the market?
A Highly Leveraged Market
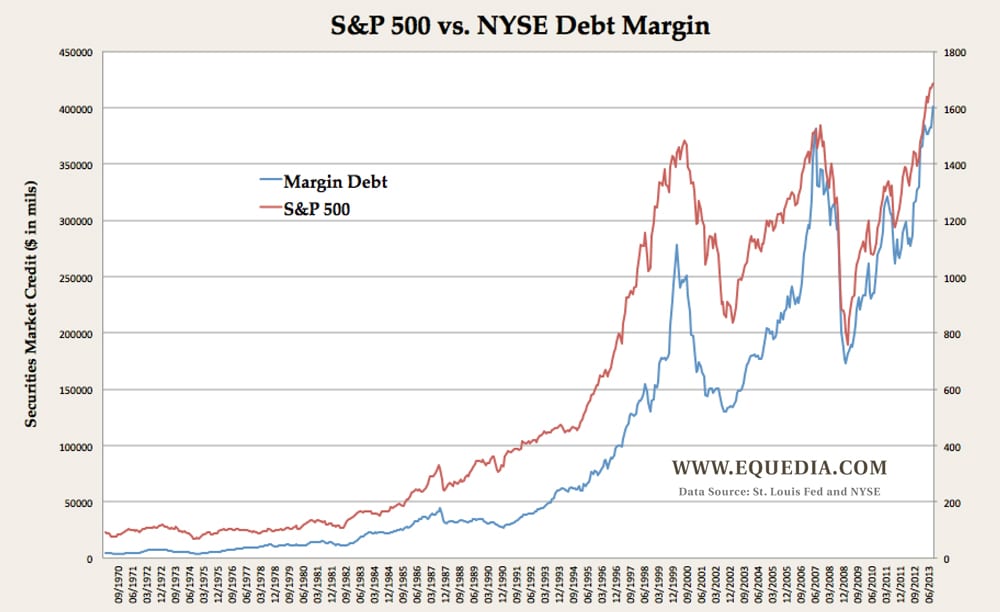
"Margin debt amounted to $379.5 billion in the month of March. The highest margin debt amount previously was $381.4 billion back in July 2007. That means the amount of money people are borrowing to buy stocks are now back at pre-2008 levels."
In September, the NYSE margin debt level reached a record-breaking $401.2 billion.
Take a look this chart:
Going back to the 1970's (and beyond), margin debt levels never surpassed the S&P 500, relative to this chart overlay.
But when the margin debt level crossed the S&P 500 back in 2007...well, we all know what happened in 2008.
Since 2007, the distance between the S&P 500 and NYSE margin debt level lines in this chart have been very close. This shows us that the amount of leverage in the stock market has never been higher, and that the rise in the S&P is closely associated with the amount of "borrowing to buy stock" taking place.
It also means the market is walking a very fine line. Any sudden drops could force margin calls that could slam the market down extremely fast.
However, I suspect that if that were to happen, we'll likely see a trading halt across many stock exchanges in order to prevent a major crash. Then it will be blamed on the
algo-softwares not being able to handle all of the trades, as the banks and cohorts collaborate to prevent the margin calls from slamming the market back down.
I present you the above chart to show you the fine line we've been walking since 2008, and how close we have been to falling down. However, I still predict that we will see the S&P move to 1800 before the end of the year, barring any major economic shock.
Just because we're walking a fine line, doesn't mean that line is not pointing up.
Equedia Network Corporation is also a distributor (and not a publisher) of content supplied by third parties and Subscribers. Accordingly, Equedia Network Corporation has no more editorial control over such content than does a public library, bookstore, or newsstand. Any opinions, advice, statements, services, offers, or other information or content expressed or made available by third parties, including information providers, Subscribers or any other user of the Equedia Network Corporation Network of Sites, are those of the respective author(s) or distributor(s) and not of Equedia Network Corporation. Neither Equedia Network Corporation nor any third-party provider of information guarantees the accuracy, completeness, or usefulness of any content, nor its merchantability or fitness for any particular purpose.


