Quick Note –
I have a special fondness for Canada (except the Vancouver Canucks, who are once again leading their poor suffering fans to yet another big disappointment come playoff time) and while I believe it’s in much better shape than its neighbors to the south, I don’t think it can escape being impacted by what’s unfolding here. Like it or not, Americans buy more than three-quarters of everything Canada exports, which accounts for nearly a quarter of Canada’s GDP. Yes, it may no longer be true when America sneezes Canada catches cold, but it appears prudent for Canadians to at least put on a sweater and gloves.
CAUTION
The Sub-prime mess and an economy heading toward or already in recession is most likely going to create some headlines like this in the not-too-distant future: “Troubles in the Corporate Debt Market.” Up until this fall, defaults on corporate bonds were at their lowest levels in more than 25 years. But, with an absolute binge of borrowing in this millennium and an economy heading for the dumps, I anticipate heightened concerns going forward in the so-called “high yield” (who buys low-yield bonds, anyway-lol) market. Citigroup’s (yes, they are in trouble themselves) credit research team has issued a warning worthy of heed:
Summary –
The public-at-large, especially those poor souls who watch “TOUT-TV” (CNBC-TV), have no real idea how enormous this crisis is. First and foremost, the debt markets are ten times larger than the stock market yet most investors misunderstand it or watch it - UNTIL NOW!!! Economic life begins and ends with the debt market as financings for governments, companies and pension funds with credit instruments are done there on the belief loans will be repaid on a contracted schedule with interest.
Here’s why I believe history will end up not being kind to former Fed Chairman Greenspan: banks and pensions profited when there was a wide difference between short and long term interest rates. They took in on the short side and loaned/invested out on the long side. But thanks to Greenspan’s allowing rates to fall incredibly low and seeing the yield curve all but disappear, banks and pensions ended up willing patsies for the plethora of exotic instruments Wall Street created at the expense of borrowers who could least afford the risk. Now the time has come to pay the piper in the debt market, and for America to pay for years of living way beyond their means.
Thursday, January 17, 2008
Peter Grandich On The Markets 2007+2008


Breakwater + Metals Report=But Analyst Say Buy


The base metal complex was indicated lower across the board during London Metal Exchange premarket trade on Wednesday, with the bearish tone set by weak data out of the US and a stocks selloff overnight taking its toll on the commodity spectrum, a trader with an LME ring dealer said. "It's all major panic this morning -- the stocks markets were down yesterday and overnight and even gold is down," he said, suggesting that this softness was not metal-specific. He said the poor retail figures out of the US on Tuesday had caused the Dow Jones to collapse and the uncertainty had a ripple effect across the precious metals, oil and base metals.
"With regard to metals, we saw the reweighting by funds come to an end on Monday evening and since then we have seen lower prices because the funds are not buying," he said.
Basemetals.com analyst William Adams said Wednesday that going forward it does look like the markets are adjusting further for a US recession.
"Especially as the weakness in the housing market seems to have caught up with the consumer judging by yesterday's retail sales data," he said. But Adams said "with the powers-that-be working to prevent a full-scale slowdown in the US, it is likely that they will produce something for the markets to hang their hopes on and that may produce a relief rally which in turn could steady the markets for a while." He said although observers should expect further weakness in the short term, "we need to be on the look out for central bank announcements which may see some value buying return to the metals." Adams noted that overall the wider markets were weak and that was leading to a general selloff with gold now down around $885/oz. "So this resembles the various risk reduction selloffs last year that coincided with equity routs that saw all asset classes suffer as investors reduced exposure across the board," he said.
Meanwhile, bellwether contract copper was down $182 to $6,978/mt, basis three-months, while aluminium had lost $12 from its previous close to $2,471/mt. The trader noted that aluminium was holding its own remarkably well and with the large volumes traded on this contract it tended to be less reactive than the other metals. Lead was indicated at $2,576/mt on Wednesday morning, down $79 from its previous close, while nickel was at $27,700/mt off $700 from its Tuesday close. Tin was bid $200 lower at $16,050/mt, while zinc was down $40 to $2,260/mt. Aluminium alloy was bid $5 lower that its Tuesday floor trade close at $2,325/mt, while North American alloy was indicated at $2,320/mt, unchanged from its last kerb bid.
Source

Commodity Bull: Jim Rogers Says Super Cycle Will Continue In 2008

“A trend in motion, will stay in motion, until some major outside force, knocks it off its course.” After gyrating within a sideways trading range over the past 18-months, the “Commodity Super Cycle,” measured by the Dow Jones-AIG Commodity Index, (DJCI), resumed its upward course in the second half or 2007. Led by the agricultural, energy, and precious metal sectors, the DJCI closed at an all-time high.
According to famed hedge-fund trader Jimmy Rogers, the 20th century has seen three secular bull-markets in commodities from 1906-1923, and from 1933-1955, and 1968-1982, spanning an average of 15-years. The current bull market for the DJCI is now six-years old, and Mr Rodgers thinks the “Commodity Super Cycle” has many more years to run, albeit with some nasty corrections along the way.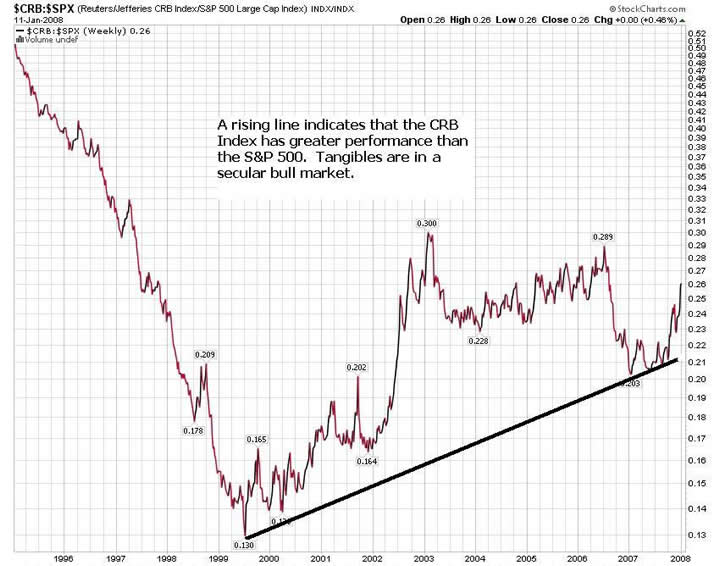
Jim Rogers is widely known as one of the most insightful commodities bulls in the market today.
Rogers agrees that the commodities market runs in what might be called “supercycles”; 10-20 year stretches when pent-up demand meets the long lead times required to bring on new supply, sending prices steadily higher. With China, India, wider Asia and other emerging markets growing fast, he thinks the current commodities bull market has plenty of room to go.
Rogers said that "on the basis of historical precedent", he expects that "the lifespan of the current commodities cycle will endure until 2014 to 2022."
Commodities Secular Bull Continues Into 2008 - Many More Years to Run!
Jan 16, 2008 - 09:11 AM By: Donald_W_Don
The rebirth of the secular bull market of commodities beginning in 2000 can be mainly contributed, first to the cresting and eventual decline of the U.S. dollar and second, the mounting economic expansion of China and India. Combined, these two forces have propelled raw material prices into a long-term uptrend.
The current extended rise in natural resources is best measured against a broad equity market. In Chart 1, the Commodity Research Bureau Index (CRB) and the S&P 500 are compared for performance over the past 12 years. During most of the 1980s and all of the 1990s, paper-based equities (S&P 500) greatly outperformed raw materials (CRB).
Bottom line: Bull markets in commodities historically run for 14 to 21 years. As this market has started in 2000, upward growth can be expected for another six years or more.
Investment approach: As the secular bull market in commodities shows no indications of weakening and long-term performance still favours raw materials over the S&P 500, growth portfolios should continue to be overweighted in tangibles and underweighted in paper-based industries.

Base Metals Stockpiles & Prices 3 |
"Now the reason I mentioned earlier that most base metals were running tight inverse correlations with their LME stockpile levels is because not all of them are currently doing so. And zinc is one base metal that is exhibiting some peculiar behavior.
Zinc’s major upleg lagged copper’s a bit in that its initial large LME stockpile draw remained on a linear descent through the end of 2006. But this also led to zinc outperforming copper in the second half of 2006 as it didn’t hit its apex until the end of November.
And 2006 was an incredible year for zinc. After rising 64% in 2005, it soared another 142% in 2006. This was of course on the heels of zinc stockpiles that were just obliterated, falling 78% on the year alone. The inverse correlation worked beautifully in 2006.
But 2007 has certainly been a different story. Looking at what the price of zinc has done in 2007 you would think LME stockpile levels were soaring. But this is hardly the case. Now when zinc stockpiles leveled in December 2006 it makes sense that some of the speculative risk premium built into its lofty price would be shed. And this is what we saw. It then also makes sense that when stockpile levels started to fall once again in April 2007 that zinc would rally.
But this rally only lasted for one month before zinc gave up its ghost and started falling to the levels we see today. This has been quite odd price behavior as there never really was a sizeable build in stockpile levels since the flattening one year ago. In fact, from April 2007 to the end of October 2007 LME zinc stockpiles fell another 48% to record lows! At only about 60k metric tons, the markets were faced with the equivalent of only two days of daily global consumption.
And these disturbingly-low stockpile levels don’t seem to phase the zinc market one bit. I honestly cannot figure out why. From a technical perspective we do see a classic head-and-shoulders pattern in this chart. And this type of pattern is typically bearish, usually leading to a trend-reversal pattern. A technician would look at zinc’s price chart and not be surprised to see it decisively break its neckline. But in my experience fundamentals often trump technical noise. Not so with zinc.
But like copper we need to look at zinc in a strategic context. Zinc is still 214% above its 2003 low of $0.34. As for LME zinc stockpile levels, as recent as 2004 they were nearly 800k metric tons! Still below 100k today, they are vastly lower than just a few short years ago. Ultimately I am long-term bullish on zinc, but I am a little worried about its near-term price if there is a big build in its stockpile levels. We’ll have to wait and see."
Source

